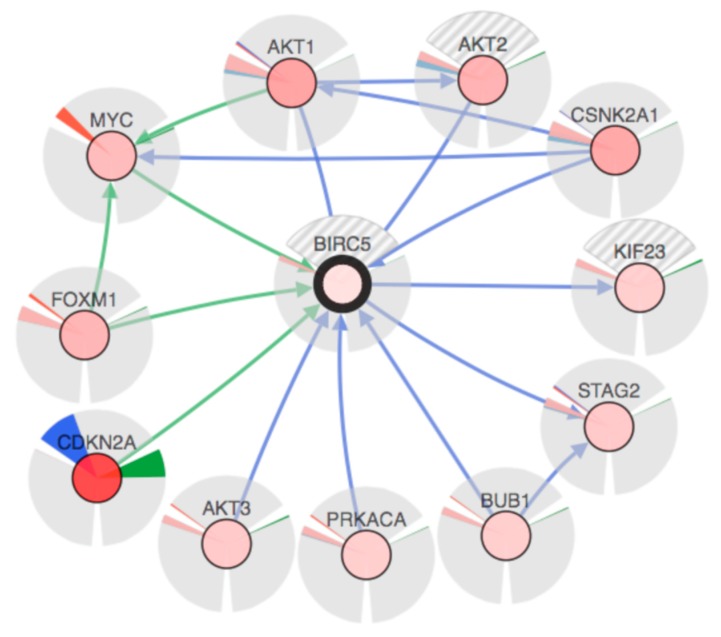
Figure 3.
Network involved in the expression of the BIRC5 gene. Blue lines indicate genes controlling the state change of those genes to which the arrows are pointing; while the green lines indicate genes controlling the expression of those genes to which the arrows are pointing. Each gene is represented by a colored nucleus, indicating its overall alteration in the BIRC5 expression (the stronger the color intensity, the greater the alteration) surrounded by three areas: one filled with the color green, indicating how much the gene is mutated; the second one filled by both blue and red colors, indicating respectively the amount of homozygous deletion and the amplification of the gene; the third one filled by both pink and light blue colors, indicating respectively the upregulation and downregulation values of the gene. Where one or more areas are filled by grey and white stripes, data are missing.

