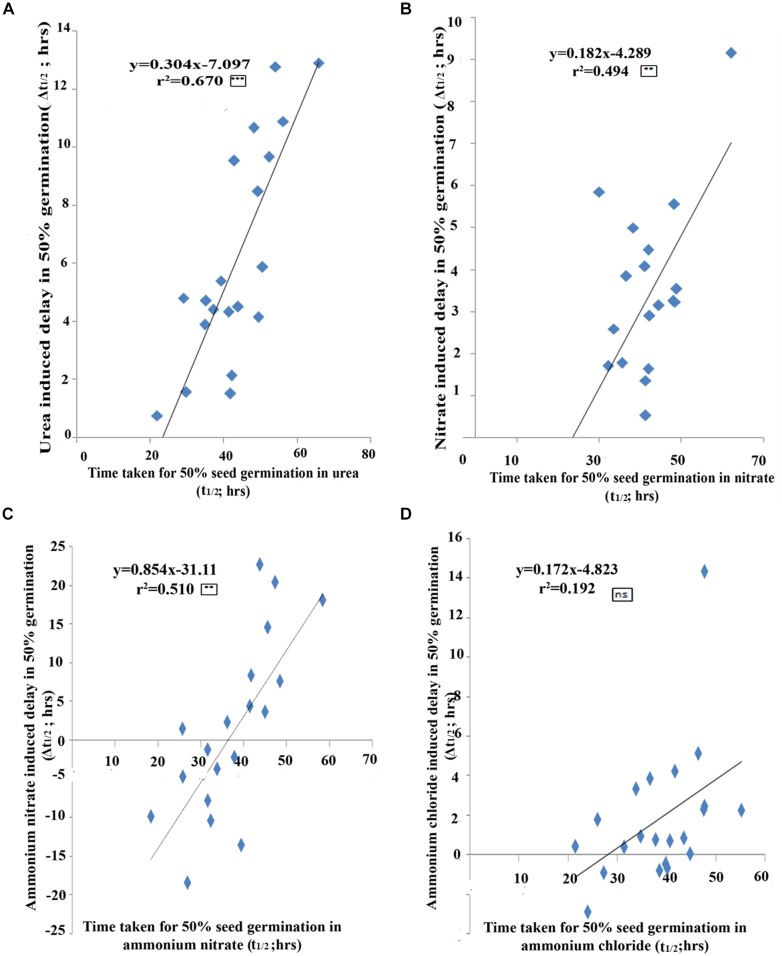
FIGURE 3.
The extent of N-effect on germination as a function of the inherent germination rates of genotypes. Scatter plot of 21 genotypes between the time taken for 50% seeds to germinate (t1/2) and N-induced delay in 50% seeds to germinate (Δt1/2) for urea (A), nitrate (B), ammonium nitrate (C), and ammonium chloride (D) N treatments. The effect of N increases with the inherent germination rate of the genotype, with fast germinating genotypes least delayed by N whereas slow germinating genotypes are most delayed by N. The significance levels are shown as stars next to R2 values. ∗Denotes significant at P < 0.05, ∗∗denotes significant at P < 0.01, ∗∗∗denotes significant at P < 0.001 and ns denotes non-significant.

