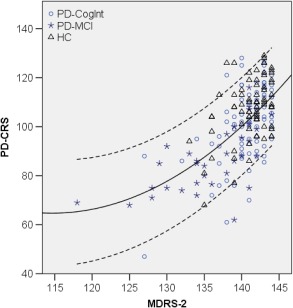
Figure 2.

Scatterplot of raw scores of MDRS‐2 and PD‐CRS in cognitively intact PD patients, PD‐MCI patients, and healthy control subjects. Continuous line: regression line describing the relation between both scales (R2 = 0.39); dashed lines: 90% individual confidence interval.
Abbreviations: HC, healthy control subjects; MDRS‐2, Mattis Dementia Rating Scale‐2; PD‐CogInt, cognitively intact PD patients; PD‐CRS, Parkinson's Disease‐Cognitive Rating Scale; PD‐MCI, PD patients with mild cognitive impairment.
