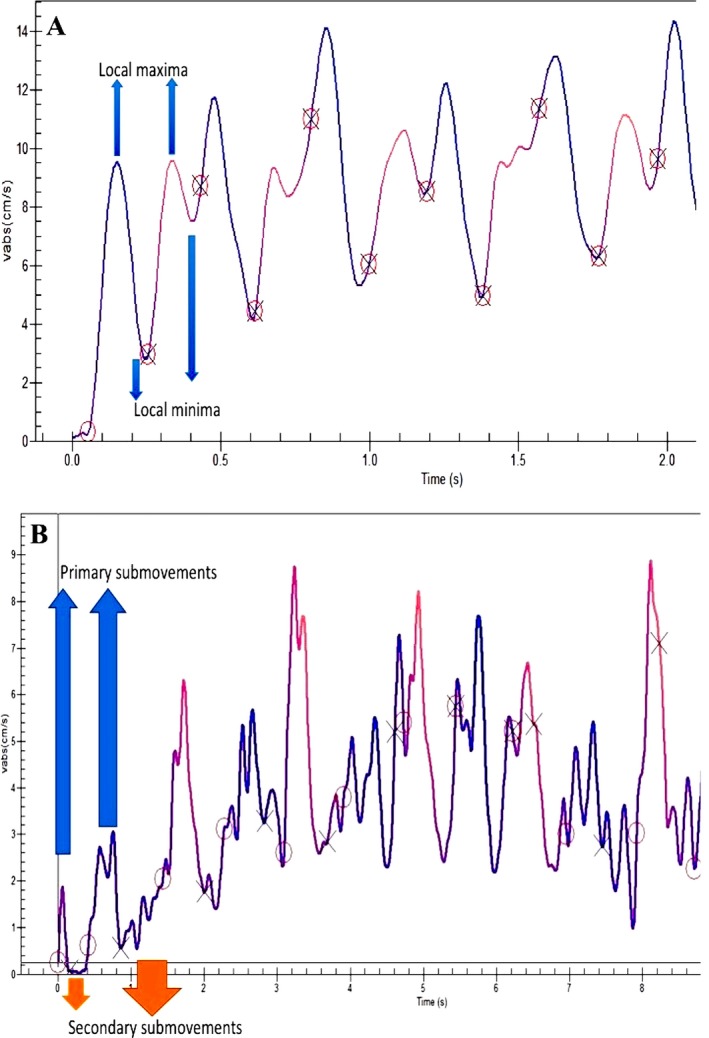
Figure 2.

A: Absolute velocity‐versus‐time graph from a healthy control. Local maxima and local minima are located. B: Absolute velocity‐versus‐time graph from a patient demonstrating primary and secondary submovements. In the graph, (O) indicates the start of the primary submovement, and (X) indicates the start of the secondary submovement (from the authors’ unpublished collection).
