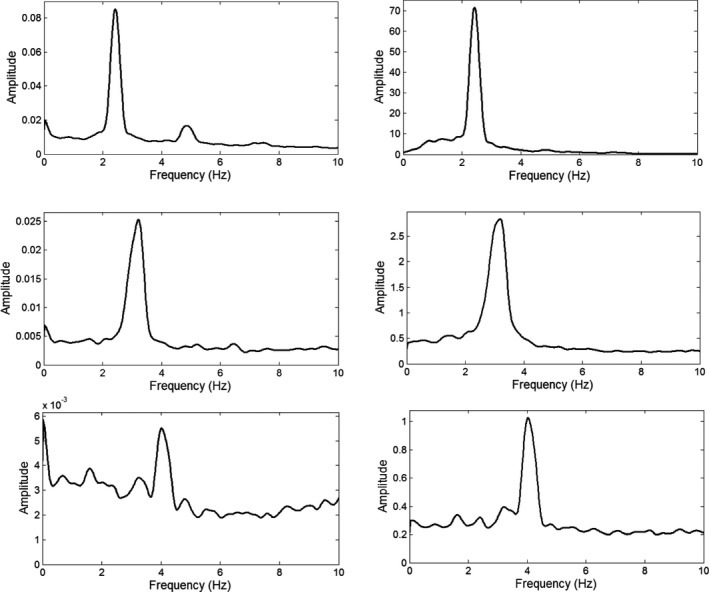
Figure 1.

Representative amplitude (one‐half peak‐to‐peak) spectra for a patient with TRS 3 (top row), TRS 2 (middle row), and TRS 1 (bottom row). The spectra were computed with an FFT. Amplitude (square root of power) is plotted versus frequency. Amplitude units are in units of gravity (g = 980 cm/s2) for accelerometry and deg/s for gyroscopy. For accelerometry (left column) and gyroscopy (right column), the tremor spectral peak becomes an increasingly dominant part of the amplitude spectrum with increasing tremor severity. The small harmonic peak at twice the tremor frequency in the upper left acceleration spectrum could be attributed, at least in part, to gravitational artifact.10
