
Figure 3.
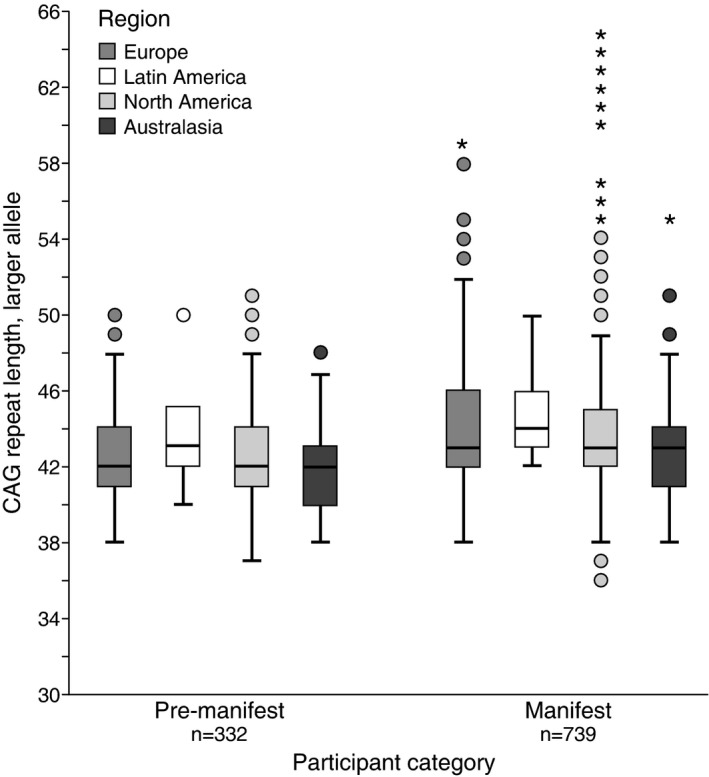
Distribution of CAG repeat lengths. Box‐and‐whisker plots showing distribution of CAG larger allele repeat length per region and HDGEC subject category. Circles represent values greater than 1.5 × IQR (interquartile range); stars represent values greater than 3 × IQR.