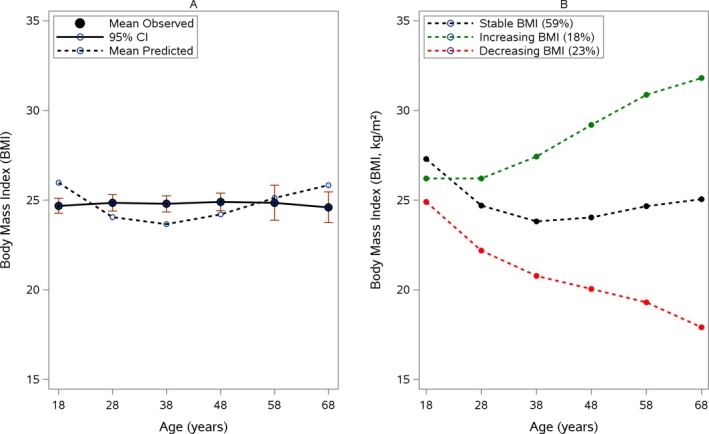
Figure 1.

(A) Mean decline in body mass index (BMI) and (B) and BMI group trajectories. (A) The mean observed BMI (in kg/m2; solid line) with 95% confidence intervals (CIs) is compared with the predicted BMI (dashed line) over time according a linear mixed model equation: BMI = 25.9–3.1 * age + 1.1 * age2 − 0.11 * age,3 where age was measured in decades starting from age 18 years. (B) Weighted, subject‐specific predictions of BMI trajectories are illustrated according to a latent class mixed model equation: stable BMI (black line) = 27.3–3.7 * age + 1.2 * age2 − 0.11 * age3; increasing BMI (green line) = 26.2–0.83 * age + 0.94 *age2 − 0.11 * age3, and decreasing BMI (red line) = 24.9–3.6 * age + 0.99 * age2 − 0.11 * age3.
