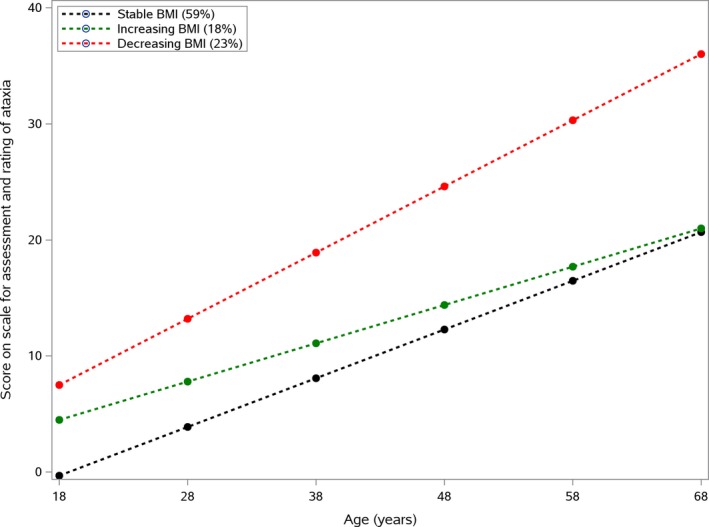
Figure 2.

Progression of scores on the Scale for the Assessment and Rating Ataxia according to body mass index (BMI) evolution. Stable BMI (in kg/m2; black curve) = −0.32 + 4.2 * age; increasing BMI (green curve) = 4.5 + 3.3 * age; and decreasing BMI (red curve) = 7.5 + 5.7 * age.
