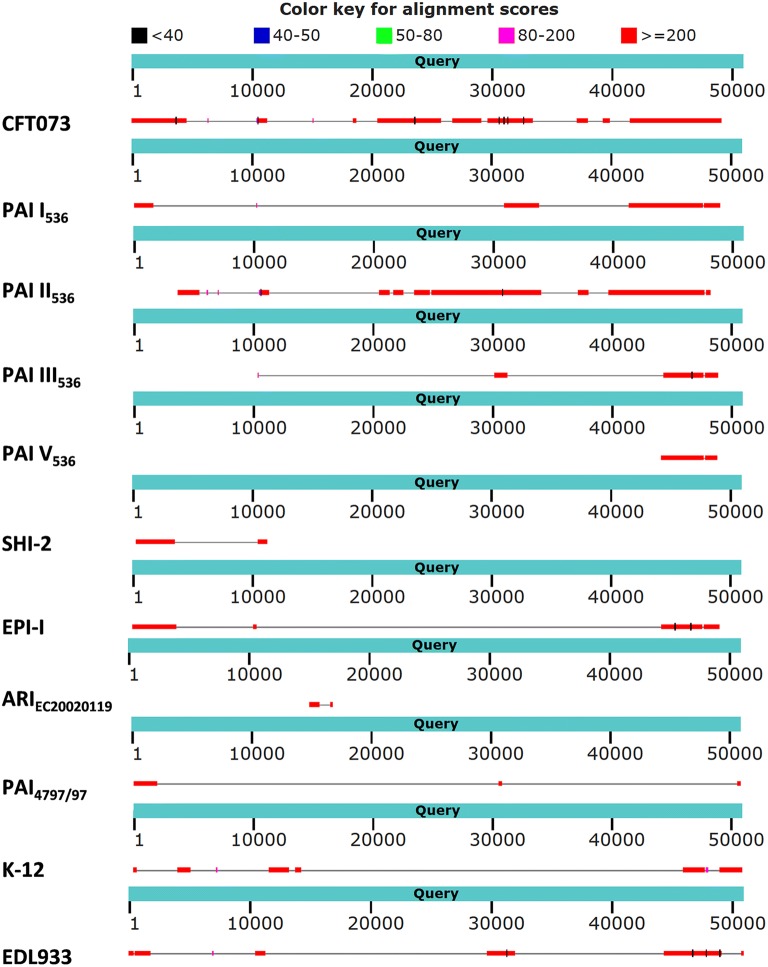
Fig. 5.
Schematic overview of Blast results for selC GEI in comparison with different strains and pathogenicity islands. The query sequence (blue bars) of the new GEI shows information of nucleotide positions and, below that, the allocated sequence of the respective strains or PAIs (grey line) with significant sequence matches (red bars)

