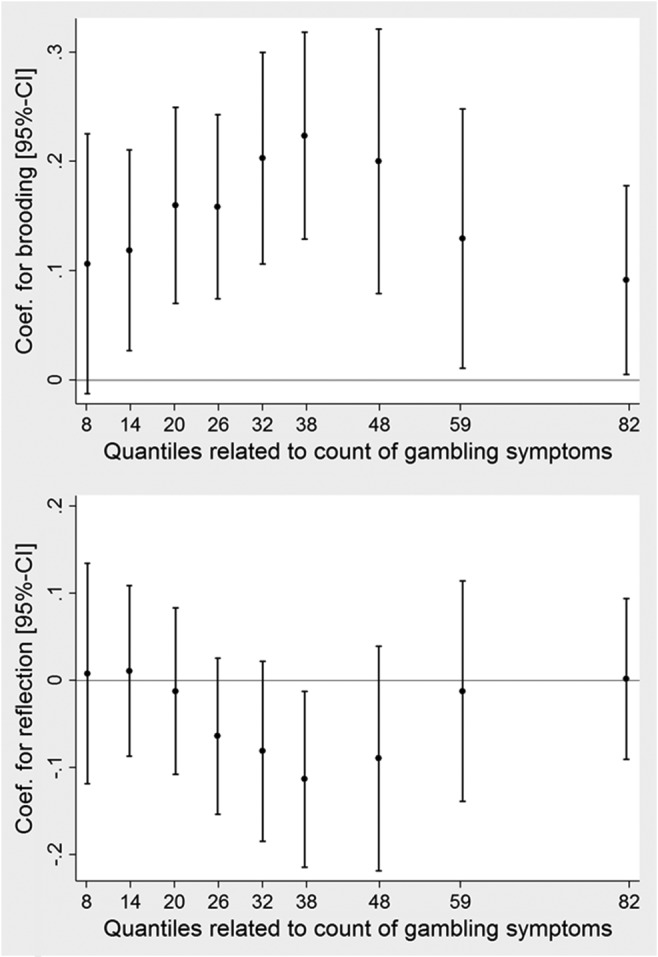
Figure 2.

Results from multivariate quantile regression models including all covariates. The dots with 95% confidence interval whiskers represent the adjusted coefficients for brooding (top)/reflection (bottom) from models testing all levels of the dependent variable
