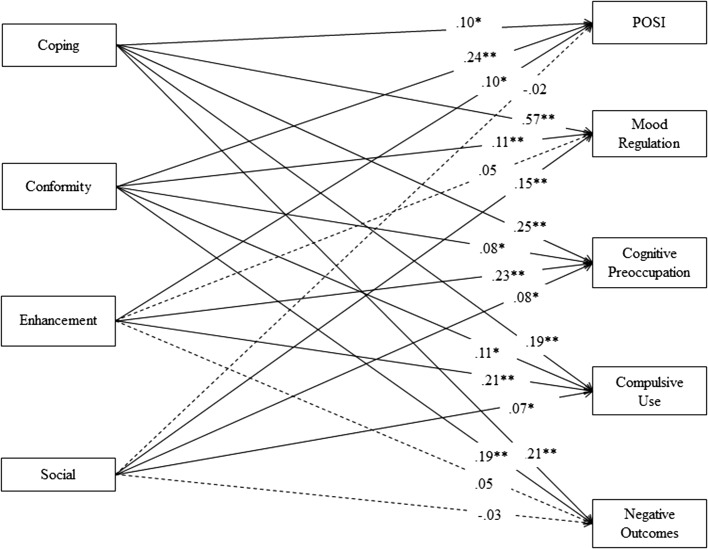
Figure 2.
Tested model of the interrelationships between the study variables. Note. N = 770. The error covariance between the independent variables was defined in the model (Grace, 2013). POSI: preference for online social interaction. *p < .05. **p < .01

