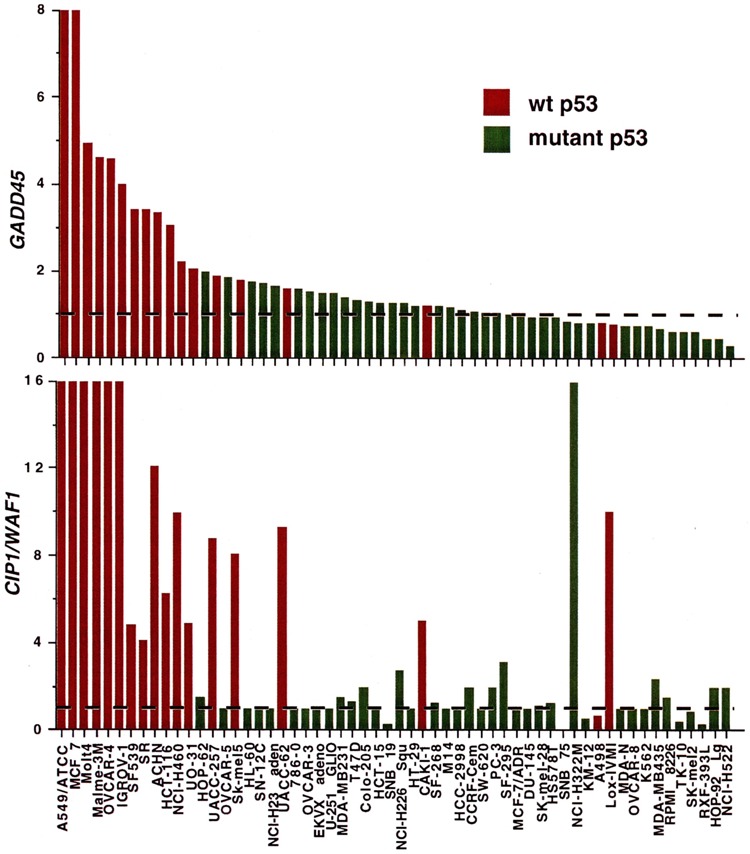
FIG. 2.

Degree of γ-ray responsiveness of the GADD45 and CIP1/WAF1 genes in tumor lines from the NCI screen. The relative increase in mRNA levels compared to that in untreated cells was determined in the lines of the NCI anticancer drug screen following a 4-h incubation after 20 Gy. Data are taken from O’Connor et al. (36) and only lines with known p53 status have been included. Lines with wt p53 genotype are designated in red, and lines containing mutant alleles in green. A value of 1 (designated by the dotted lines) indicates no change (no induction) from that of untreated controls.
