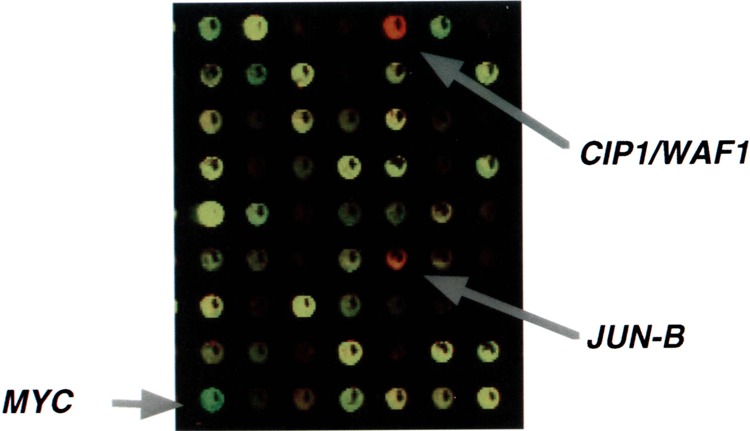
FIG. 5.

Example of cDNA microarray hybridization. Results are shown employing RNA from untreated control ML-1 cells (green fluorochrome) and ML-1 cells 4 h after treatment with 137Cs γ-rays (red fluorochrome) (1). Targets appearing as yellow spots have equal representation of both fluorochromes and indicate no change in expression by the IR treatment. Red spots, such as CIP1/WAF1 and JUN-B, are targets increased by the treatment, and green targets, such as MYC, are decreased.
