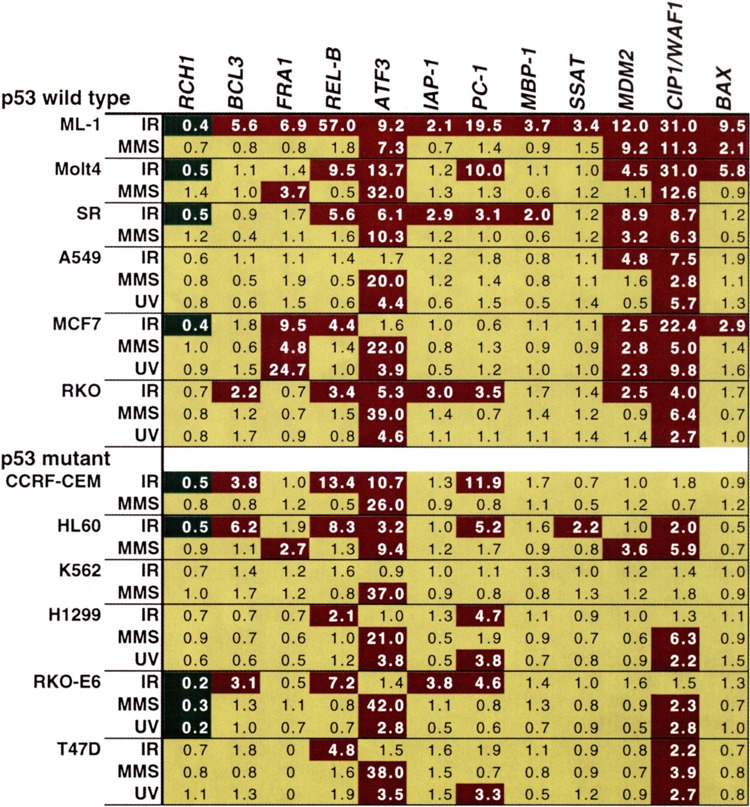
FIG. 7.

Responsiveness of transcripts identified by cDNA microarray hybridization in a panel of human tumor cell lines. Numbers shown are the relative induction or repression for each gene over levels in untreated controls 4 h after treatment with ionizing radiation (IR), methyl methanesulfonate (MMS), or ultraviolet (UV) radiation as measured by quantitative single-probe hybridization; data are taken from Amundson et al. (1). The results are color coded: red for > twofold induction, green for > twofold reduction, and yellow for < twofold change from untreated control. A zero indicates no detectable expression in either control or treated cells.
