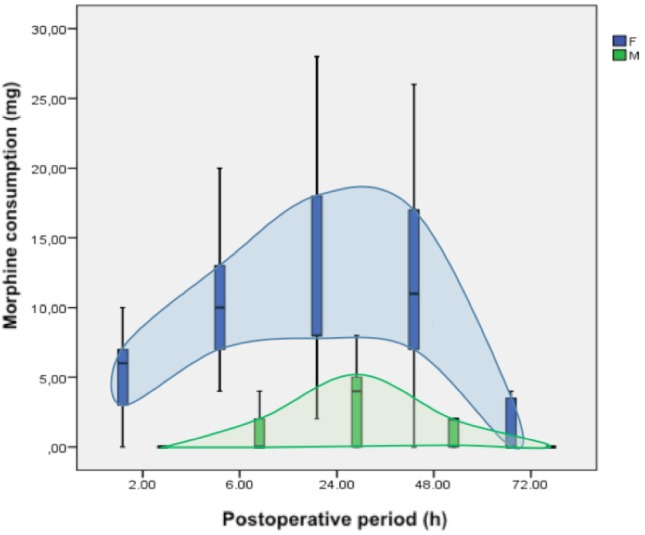
Figure 2.

Postoperative morphine consumption (mg).
Note: Data are mean (horizontal black straight segment), SD (boxplot: blue or green), and min and max (vertical black straight segment).

Postoperative morphine consumption (mg).
Note: Data are mean (horizontal black straight segment), SD (boxplot: blue or green), and min and max (vertical black straight segment).