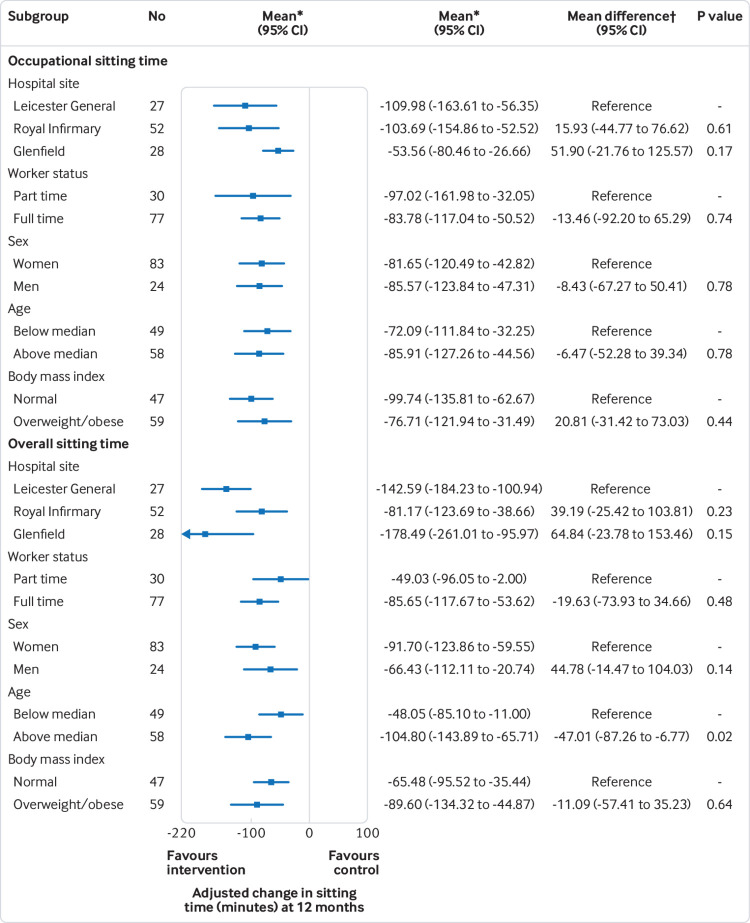
Fig 2.
Forest plot of intervention effect at 12 months on occupational and daily sitting time by subgroup. *Adjusted for cluster effect, baseline occupational sitting, baseline overall sitting, stratification category (office size ≤4 or >4 participants) and average activPAL wear times during work hours/average activPAL waking wear time across baseline and 12 months. †Interaction between intervention group and subgroups

