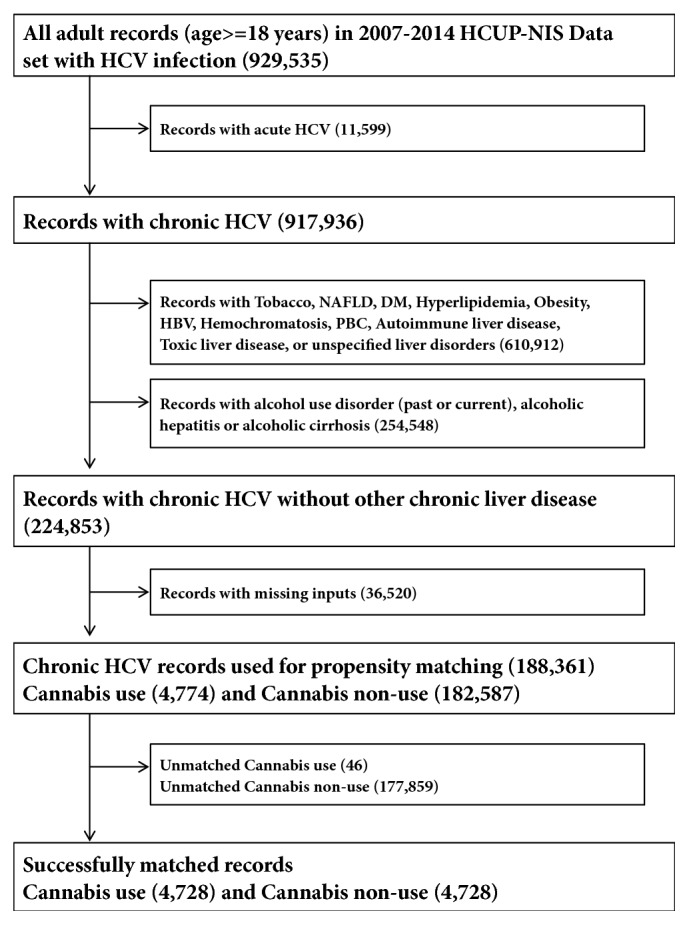
Figure 1.

Selection flow chart of study populations. Illustrative flow chart of how our study population was grouped for statistical analysis to determine the impact and disease outcomes among HCV infected individuals who use cannabis.

Selection flow chart of study populations. Illustrative flow chart of how our study population was grouped for statistical analysis to determine the impact and disease outcomes among HCV infected individuals who use cannabis.