Figure 6.
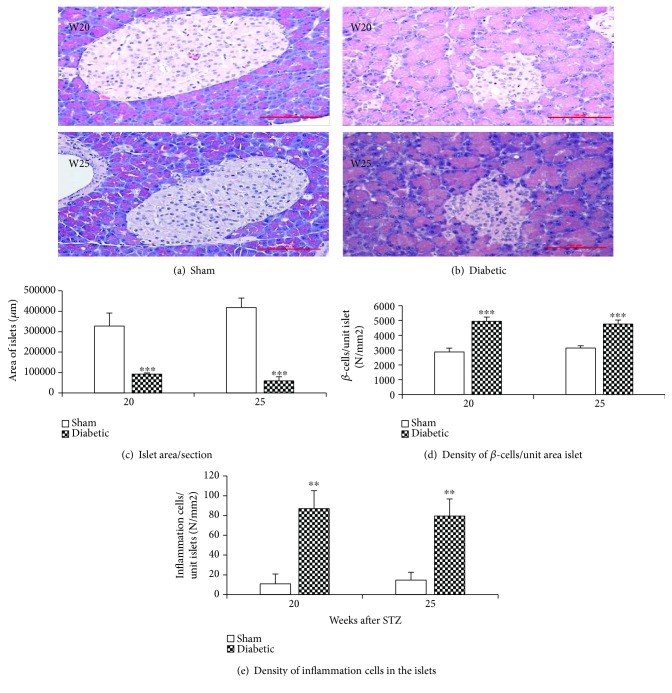
(a–e) Islet area, β-cell density, and inflammatory cell infiltration into pancreatic islets. Representative images of the pancreas from rats 20 and 25 weeks after STZ or sham injection stained with hematoxylin & eosin stain (a–b). The pancreatic islet area and β-cell and inflammatory cell density in each islet were counted under a 40x objective lens. The total area of pancreatic islets was reduced after a STZ injection compared to that in age-matched sham-injected animals (c); however, the β-cell density was significantly increased in diabetic rats compared to sham animals (d). More inflammatory cells infiltrated into pancreatic islets in diabetic rats (e). n = 5–6/group, mean ± s.e. Student's t-test, a = 2, ∗∗p < 0.01, ∗∗∗p < 0.001 (compared to age-matched sham group).

