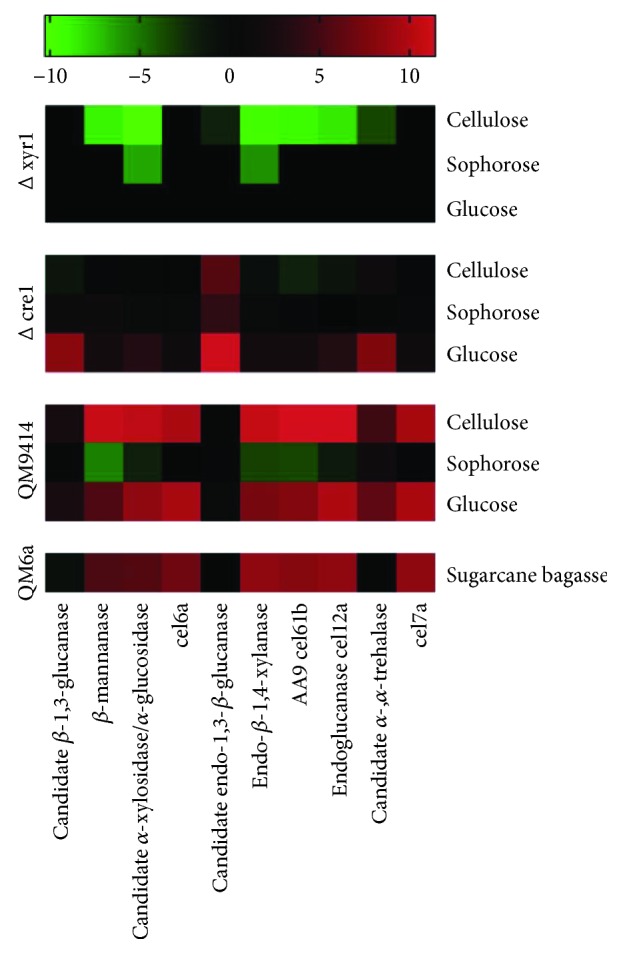
Figure 2.

Heatmap expression of Top CAZy-encoding genes differentially expressed in T. reesei strains grown in cellulose, sophorose, glucose, and sugarcane bagasse. The results of gene expressions were transformed in Log2FoldChange values and employed to heat map construction using the GraphPad Prism version 7 program (https://www.graphpad.com/).
