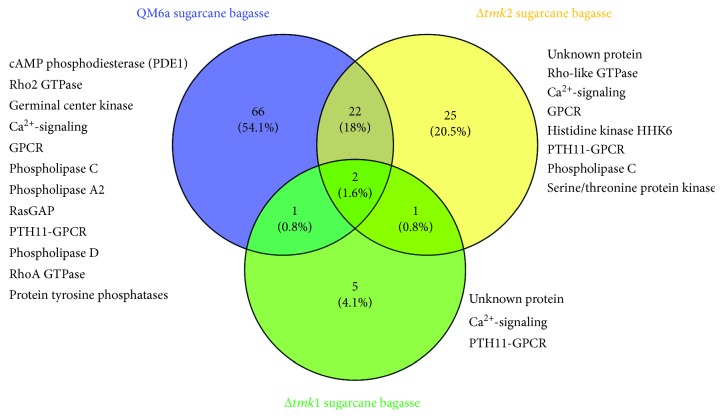
Figure 6.
Expression pattern of differentially expressed signaling pathway genes in QM6a parental and two functional MAPK-mutant genes in the presence of sugarcane bagasse. (a) Comparative Venn diagram of expressed genes between the QM6a, Δtmk1, and Δtmk2 mutant strains in the presence of sugarcane bagasse. Venn diagram clustering was designed using Venny 2.1.

