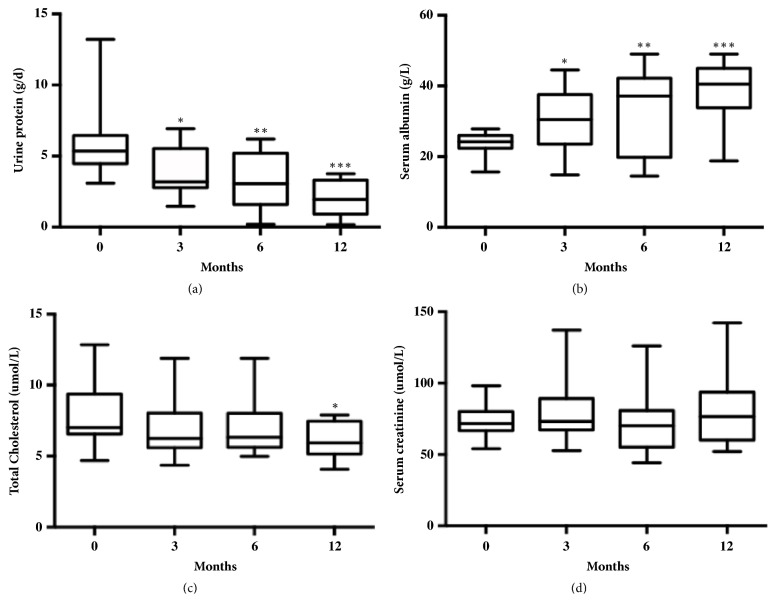
Figure 2.
Repeated measurements of selected laboratory parameters from JPQSF administration (baseline) to study end (month 12). A repeated-measures ANOVA examining the changes of proteinuria, serum albumin, and cholesterol from baseline to month 12 showed significant time effects (P< 0.05). (a) Proteinuria: ∗ indicates Bonferroni correction of the baseline and 3 months after treatment values, P<0.05; ∗∗ indicates Bonferroni correction of the baseline and 6 months after treatment values, P<0.05; ∗∗∗ indicates Bonferroni correction of the baseline and 12 months after treatment values, P<0.001. (b) Serum albumin: ∗ indicates Bonferroni correction of the baseline and 3 months after treatment values, P<0.05; ∗∗ indicates Bonferroni correction of the baseline and 6 months after treatment values, P<0.05; ∗∗∗ indicates Bonferroni correction of the baseline and 12 months after treatment values, P<0.001. (c) Cholesterol: ∗ indicates Bonferroni correction of the baseline and 12 months after treatment values, P<0.05; (d) Serum creatinine: baseline value and values during treatments compared with baseline values before treatment; serum creatinine does not show significant changes at the end of 12 months (P>0.05).

