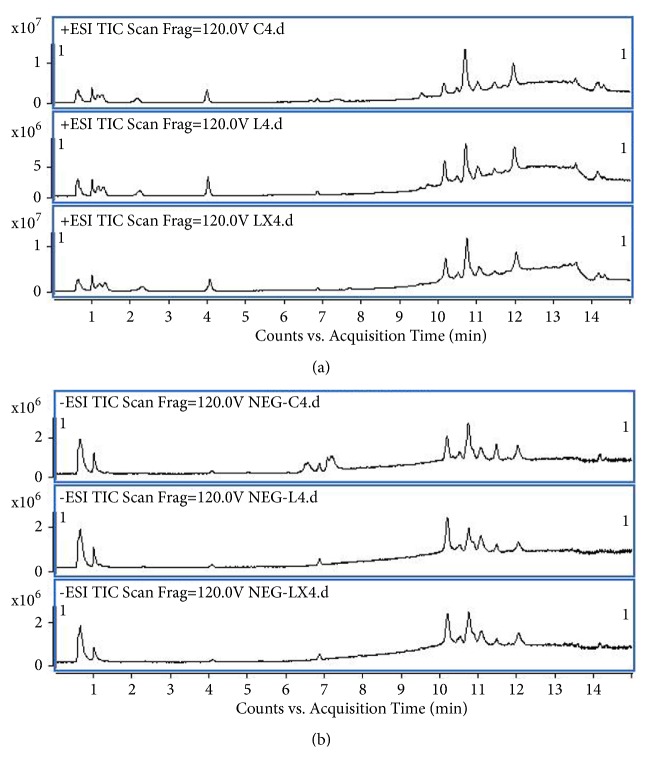
Figure 2.
The representative TICs in the positive and negative mode. Representative total ion current (TIC) chromatograms of lung tissues obtained from different group of rats in the (a) positive mode and (b) negative mode. Upper panel: sham group; middle panel: model group; lower panel: treatment group.

