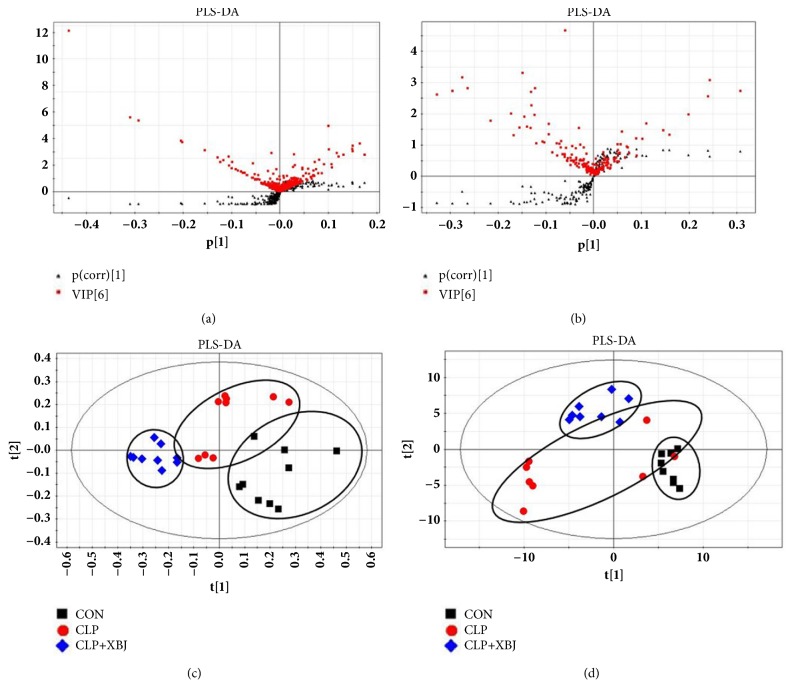
Figure 3.
PLS-DA and VIP-score plot in the positive and negative modes. The combination of S- and VIP-score plot in the (a) positive and (b) negative modes showed that a greater number of values obtained from the lung tissues were further away from the origin. Score plots of the principal component analysis performed on the HPLC/MS profile of rat lung tissues obtained from the sham group (black squares), model group (red rounds), and treatment group (blue rhombus) in the (c) positive mode and (d) negative mode.

