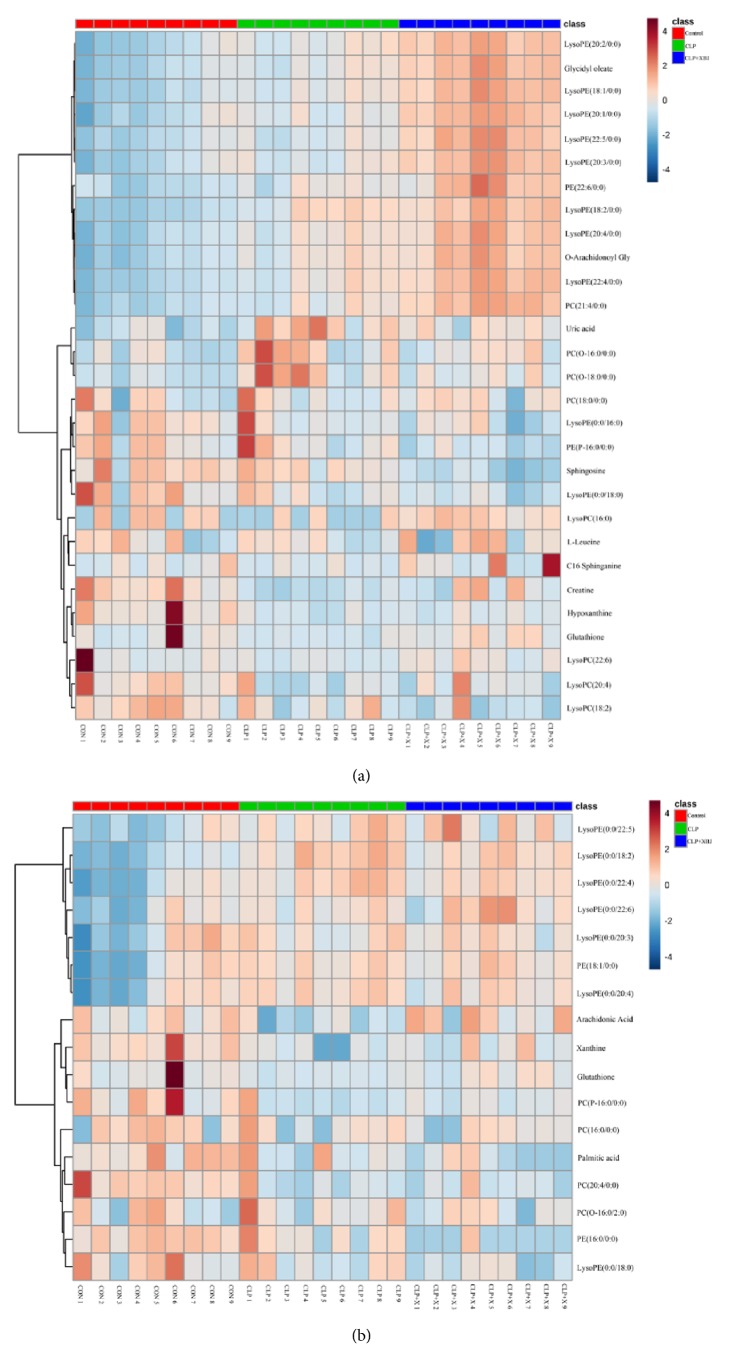
Figure 5.
The heatmap showed the expression levels of differential metabolites. Heatmap visualization of the differential metabolites in these three groups in positive (a) and negative ion mode (b). In this picture, each row represents a metabolite and each column represents the expression level (red: upregulation; blue: downregulation).

