Figure 3.
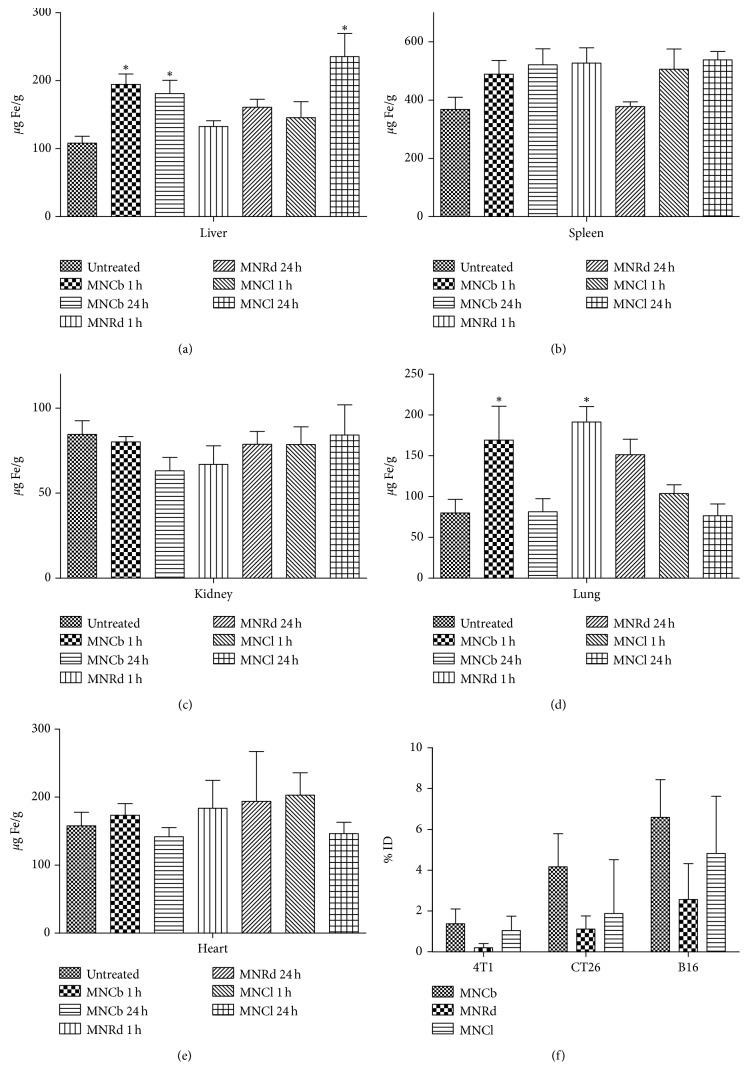
IONPs biodistribution (a–e). Iron levels measured by AES in liver (a), spleen (b), kidney (c), lung (d), and heart (e) in untreated and IONPs-treated tumor-free animals 1 and 24 h after i.v. injection (5 mg/kg). (f). Percentage of injected dose delivered to 4T1, CT26, and B16 tumors 24 h after IONPs systemic administration. Results are shown as means ± SEM. ∗ p < 0.05 in IONPs-treated vs control group (Dunnett's multiple comparison test).

