Figure 6.

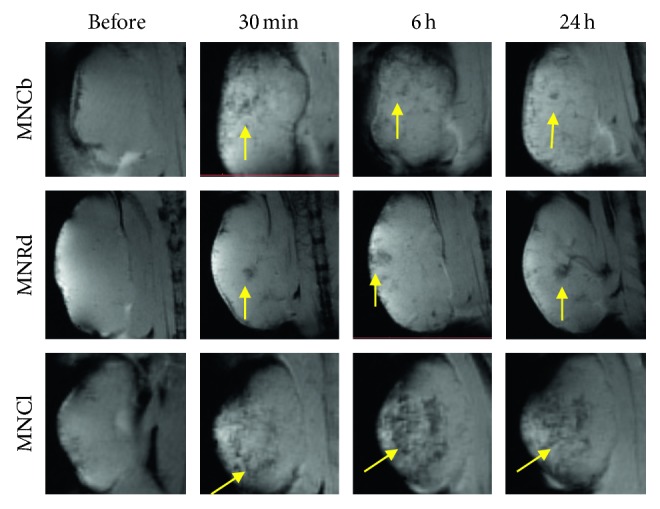
Dynamics of MNPs accumulation in CT26 tumors. Representative T 2 ∗-weighted MR images of CT26 tumors captured before and within 24 h after i.v. injection of IONPs (5 mg/kg). Foci of enhanced tumor contrasting are shown by arrows.

Dynamics of MNPs accumulation in CT26 tumors. Representative T 2 ∗-weighted MR images of CT26 tumors captured before and within 24 h after i.v. injection of IONPs (5 mg/kg). Foci of enhanced tumor contrasting are shown by arrows.