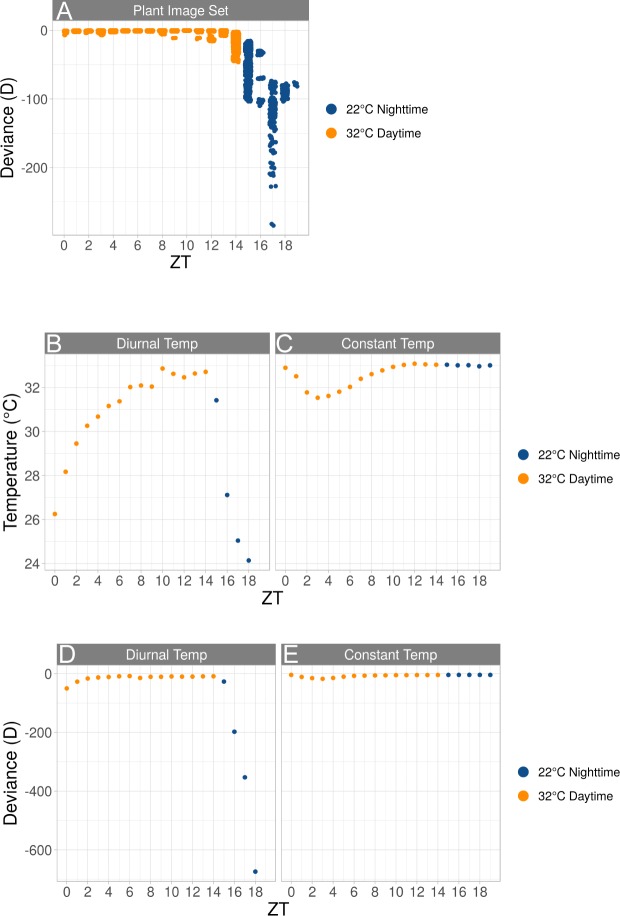
Figure 1. Effect of temperature on light intensity and image variability.
(A) Graph of calculated deviance (y-axis) within the plant image set and the hour the image was taken in ZT time (x-axis). Each dot represents a single image in the plant image set. The deviance from reference was calculated in Eq. (7). (B and C) Graphs of temperature readings (y-axis) taken at hours at which imaging was done in ZT time (x-axis) in either diurnal (B) or constant (C) conditions. (D and E) Graphs of calculated deviance (y-axis) within the temperature image set and the hour the image was taken in ZT time (x-axis) under either diurnal (D) or constant (E) conditions. Each dot represents a mean of two images in the “temperature image set”. The deviance from reference was calculated in Eq. (7). (A–C). Daytime ZT 0–14 = hr 0,700–2,100 and nighttime ZT 14–24 = hr 2,100–0,700 (A–E). Temperature settings at particular times of day are indicated, either 22 °C (blue) or 32 °C (gold).

