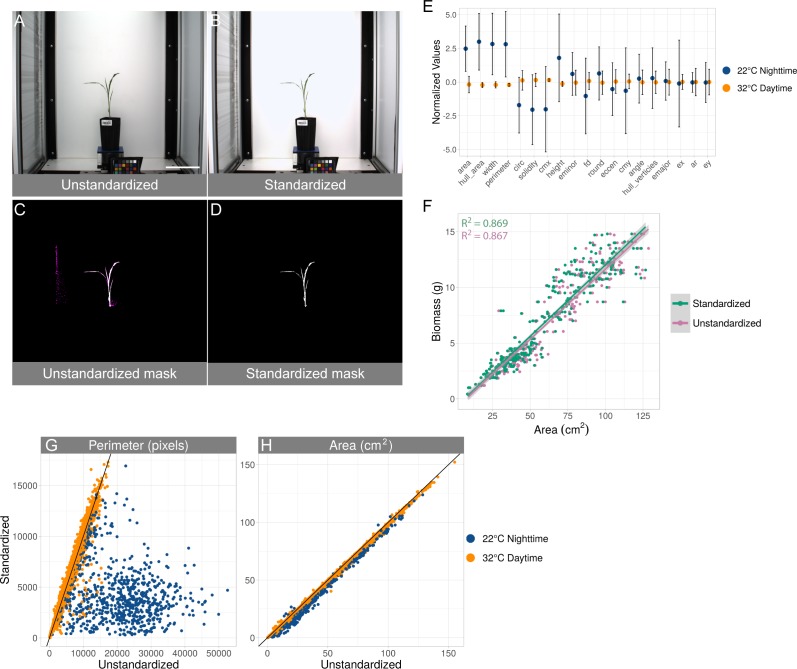
Figure 2. Standardization effects on shape measurements.
(A–D) Example of the effect of standardization. (A) original unedited image. (B) same image after applying standardization. Plant-isolation masks generated without (C) and with (D) standardization. The magenta coloring in the unstandardized mask indicates pixels that are not contained in the standardized mask. Scale bar = 15 cm. (E) Effect size (y-axis) of each of the shapes (x-axis) before and after standardization grouped by experimental day and night. Values of each shape per image are normalized by subtracting the mean and dividing by the variance. All shapes except ellipse major axis, ellipse center x-coordinate, aspect ratio, and ellipse center y-coordinate are significantly different between daytime and nighttime temperatures (Unequal variance t-test, p-value < 0.05). Shapes are sorted by increasing p-values and are: area, convex hull area, width, perimeter, circularity, solidity, center of mass x-coordinate, height, ellipse minor axis, fractal dimension, roundness, eccentricity, center of mass y-coordinate, ellipse angle, convex hull vertices, ellipse minor axis, ellipse center x-coordinate, aspect ratio, and ellipse center y-coordinate. (F) Association of biomass (y-axis) to area (x-axis) before and after standardization. Every point is an image taken on the last day within the plant image set for which weight was recorded. Linear fit (green line: y = − 0.69 + 0.126 ×; pink line: y = − 0.85 + 0.124 ×) and R2 is displayed for each condition. (G and H) Effect of standardization on perimeter (G) and area (H). Every point is an image in the entire plant image set. Displayed are the measured perimeter and area from before standardization (x-axis) and after standardization (y-axis). Temperature settings at particular times of day are indicated, either 22 °C (blue) or 32 °C (gold). Black line indicates y = x.

