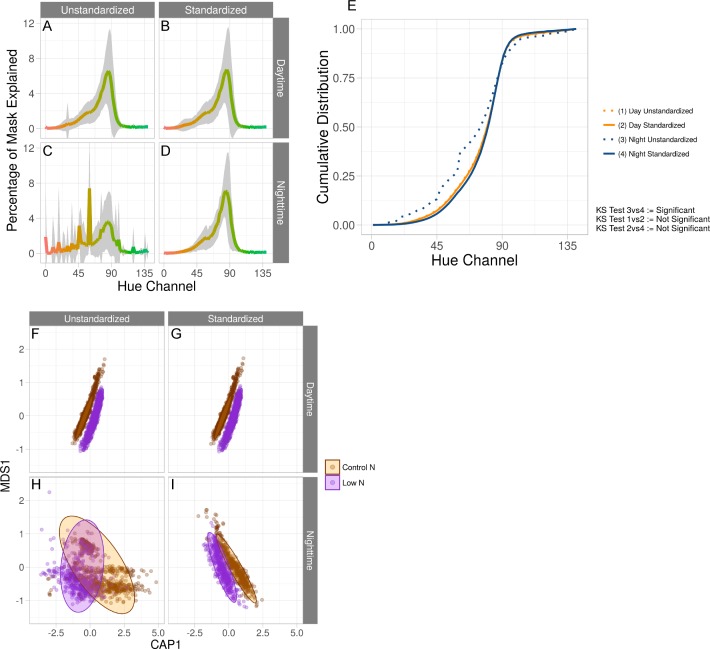
Figure 3. Standardization effects on color measurements.
(A–D) Average hue histograms of plants 19 days after planting. Shown are the average histograms of unstandardized daytime and nighttime images as well as standardized daytime and nighttime images. For each facet, the x-axis is the hue channel from 0 to 140 degrees and the y-axis is the percentage of the mask at a particular degree. The color of each degree is shown as the color of the line. Gray areas are the 95% confidence interval. (E) Using the same histograms as in (A–D), cumulative distributions of each are shown on the y-axis, and the hue range from 0 to 140 are on the x-axis. As the legend indicates, each line is given a number and the Kolmogorov–Smirnov test as described in Eqs. (8), (9) and (10) are displayed using the numbers that are assigned to each condition. (F–I) Constrained analysis of principal coordinates conditioning on time, in days, for both unstandardized and standardized images colored by nitrogen treatment for both daytime and nighttime images. Constrained axis 1 (CAP1, x-axis) is conditioned on time while multidimensional scaled axis 1 (MDS1, y-axis) is not conditioned on any variables.

