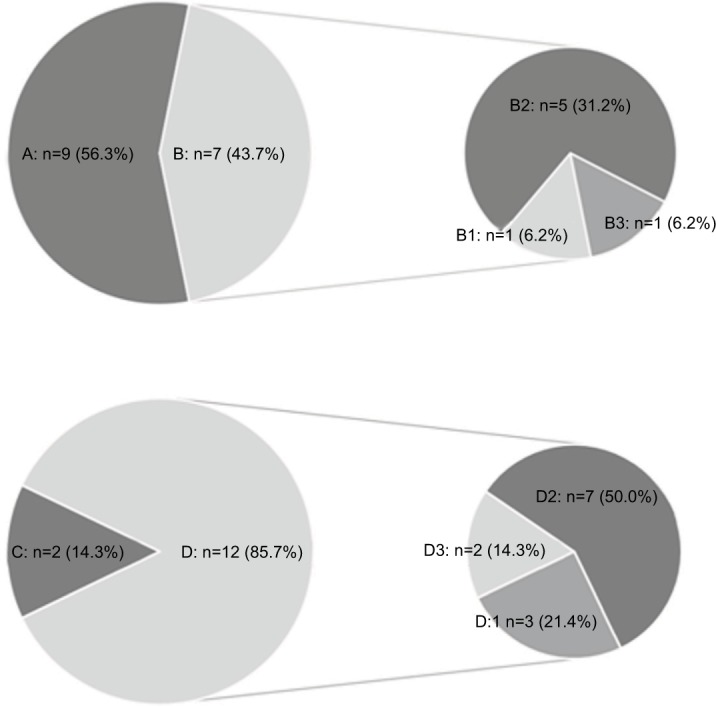
Figure 4.

Pie charts depicting the response of the ZAP patients to ozone injection.
Notes: A, B, B1, B2 and B3: the response of the ZAP patients of group A to ozone injection. C, D, D1, D2 and D3: the response of the ZAP patients of group B to ozone injection. A and C: indicated patients satisfied with an obvious pain relief (VAS <3). B and D: indicated patients showed poor improvement in pain relief (VAS ≥ 3). B1 and D1: pain degree was no different. B2 and D2: patients got satisfactory effect during and after the ozone injection, but still achieved poor pain relief (VAS ≥ 3). B3 and D3: patients achieved satisfactory effect during the ozone injection, after the ozone injection ended the pain degree returned, but not exceeding the initial level.
Abbreviations: ZAP, zoster-associated pain; VAS, visual analog scale.
