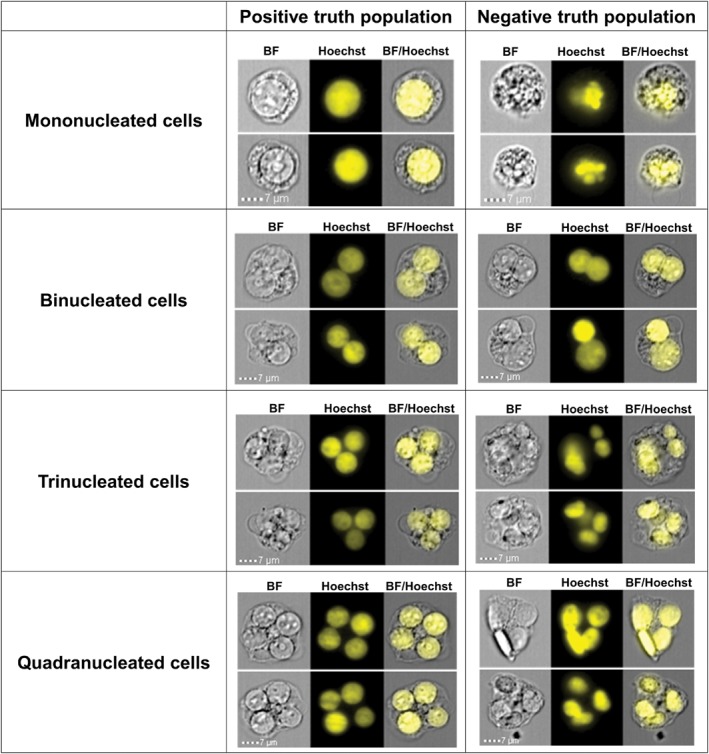
Figure 1.

Example imagery from positive and negative mono‐, bi‐, tri‐, and quadranucleated cell truth populations. The middle column contains representative images of positive truth populations that were created by selecting cells with visible cytoplasmic material and possessing nuclei of normal circular morphology and uniform intensity. The right hand column contains representative images of negative truth populations that were created by selecting cells with abnormal nuclear morphology, overlapping nuclei or nuclei of differing intensity, area, circularity, and aspect ratios.
