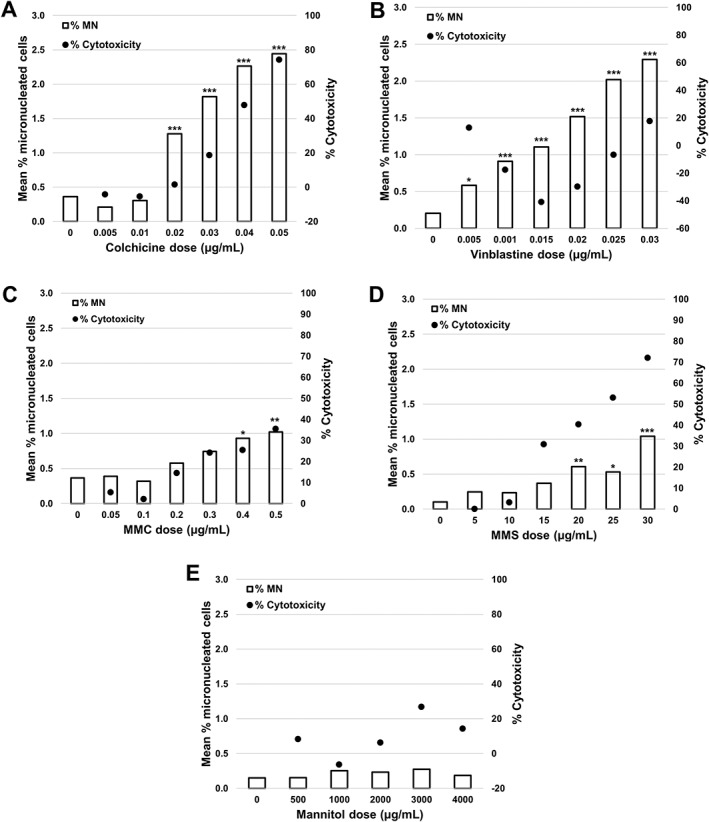
Figure 6.

Genotoxicity measured by the percentage of MN (clear bars) and cytotoxicity measured by both RPD (black circles) or RICC (white circles) following a 3 h treatment and 24 h recovery in the presence of cytochalasin B for: (A) colchicine, (B) vinblastine sulfate, (C) mitomycin C (MMC), (D) methyl methanesulfonate (MMS), and (E) mannitol. Statistically significant increases in MN frequency compared with controls are indicated by stars (*P < 0.05; **P < 0.01; ***P < 0.001). All quantities are the average of two replicates at each dose point.
