Figure 4.

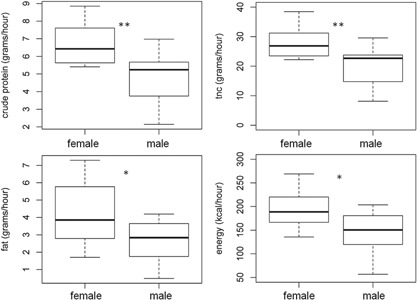
Sex differences in the intake of macronutrients (grams/hour) during the late stage of lactation (LMM, Significance levels *P < 0.05, **P < 0.01, tables with model parameters are available in SM)

Sex differences in the intake of macronutrients (grams/hour) during the late stage of lactation (LMM, Significance levels *P < 0.05, **P < 0.01, tables with model parameters are available in SM)