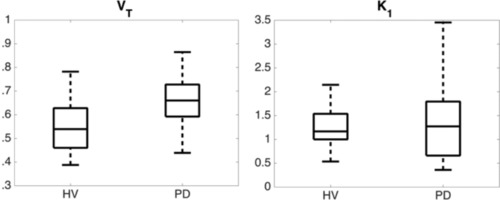
Figure 7.

Box and whisker plots of distribution volume (VT) values (left panel) and influx rate (K 1) values (right panel) estimated using two tissue compartment model and partial volume corrected image‐derived input function showing the difference between healthy volunteers (HVs) and patients with Parkinson's disease (PD) indicating no significant difference in influx, but a significant difference in VT values. (left, n = 19 HV and n = 18 PD, P = .0031; right, n = 19 HV and n = 18 PD, P = .60).
