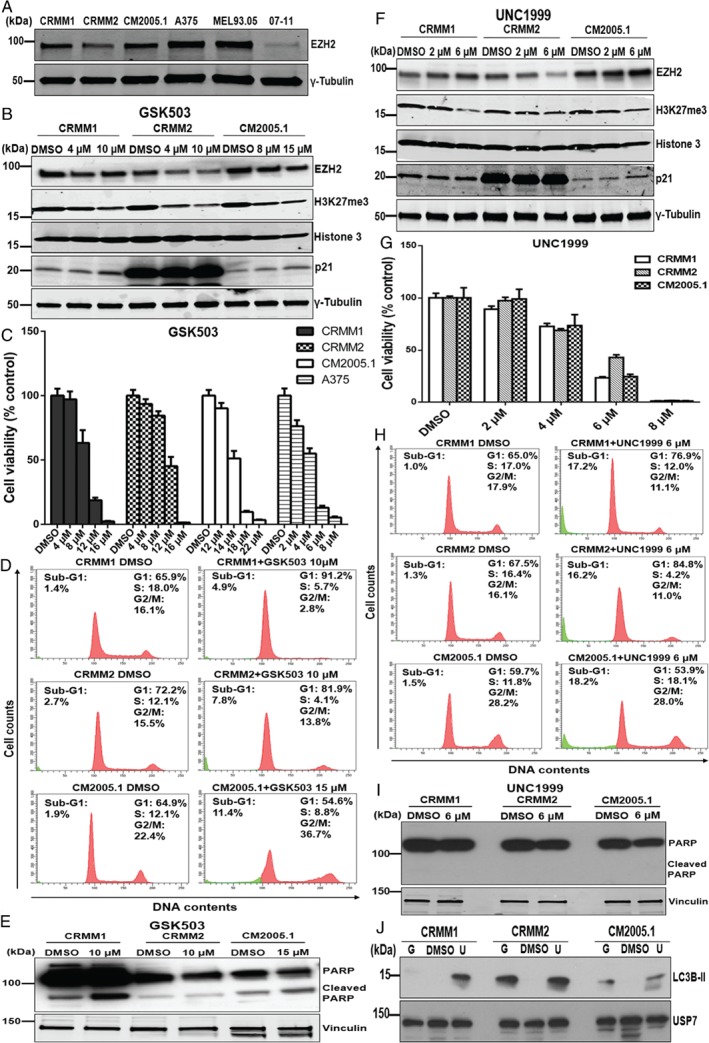
Figure 3.

Effect of the EZH2 inhibitors GSK503 and UNC1999 on CM cell lines. (A) Western blot analysis of EZH2 protein in three CM cell lines, CRMM1, CRMM2, and CM2005.1, and two cutaneous melanoma cell lines, A375 and MEL93.05; 07‐11 is a human melanocyte culture. Western blot analysis of CM cells upon 120 h incubation of GSK503 (B) or UNC1999 (F) treatment. Representative bar graphs show the proliferation of melanoma cell lines exposed for 120 h to GSK503 (C) or UNC1999 (G), respectively. The intensity (Y axis) was normalized to DMSO‐treated control cells. Data are presented as means ±SEM from one representative experiment. Histograms represent DNA content (D, H) and western blot analysis of (cleaved) PARP (E, J) following 120 h incubation of GSK503 or UNC1999. (J) LC3B‐II levels are increased following 120 h treatment of GSK503 (G, CRMM1 and CRMM2 at 10 μm, and CM2005.1 at 15 μm) or UNC1999 (U, 6 μm).
