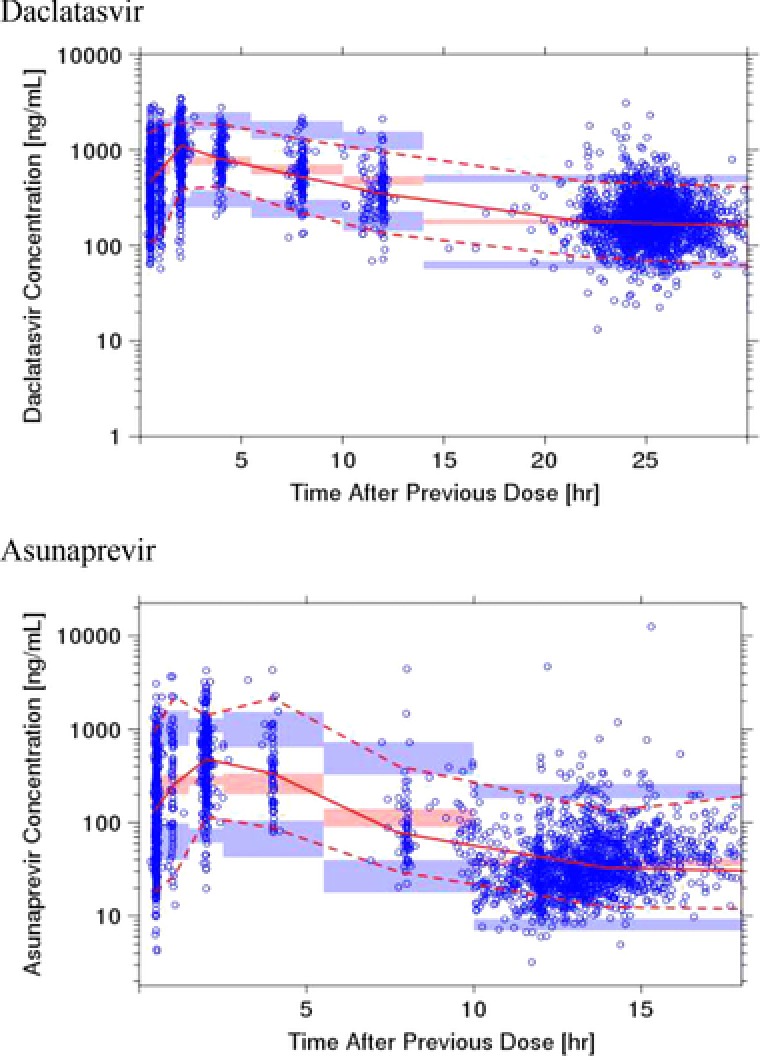
Figure 2.

Prediction corrected visual predictive checks (upper, daclatasvir; lower, asunaprevir). Circles are observed asunaprevir plasma concentrations, solid red line represents the median observed value, and dotted red lines represent 5th and 95th percentiles of the observed values. Red‐shaded areas represent the spread of the median predicted values (5th to 95th percentiles), and blue‐shaded areas represent the spread (5th and 95th percentiles) of the 5th and 95th predicted percentile concentrations. Each bin was set to cover the sampling points.
