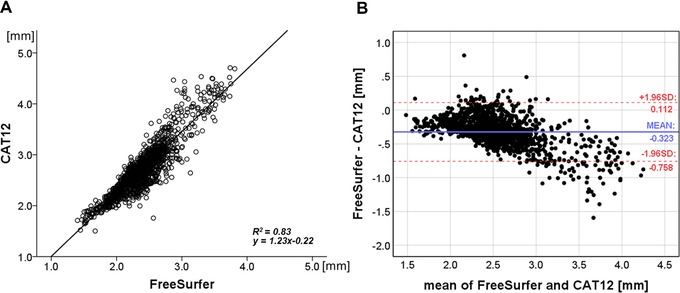
Figure 2.

(A) Correlational analysis between FreeSurfer and CAT12 mean cortical thickness (CT) values. Each data point represents a CT value for a subject at a specific region. (B) Bland‐Altman plot with limits of agreement (dotted lines) for mean CT values indicating the agreement between both methods. R 2 = coefficient of determination; SD = standard deviation.
