
Figure 3.
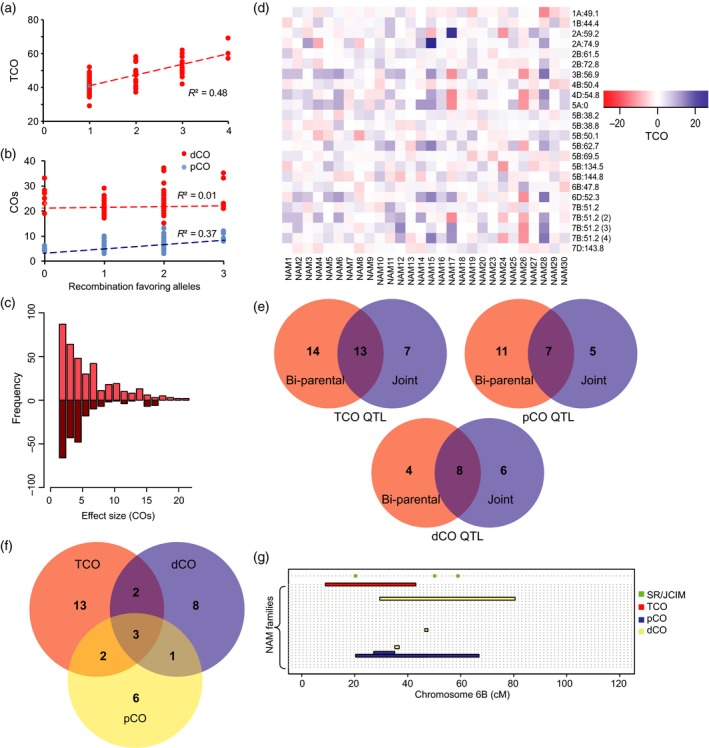
Recombination rate QTL mapping.
(a) The number of recombination increasing alleles in the RILs correlates positively with the number of TCOs (R 2 = 0.48) for family NAM30.
(b) The number of positive alleles at pCO QTL (blue) correlates positively with the interstitial COs (R 2 = 0.36) and shows no correlation (R 2 = 0.01) with dCOs in the distal (red) regions for family NAM29.
(c) The frequency of additive alleles with different effect sizes for the TCO QTL. The majority of TCO QTL alleles showed small effect.
(d) Magnitude of effect sizes relative to Berkut allele for TCO QTL identified using the SR and JCIM approaches. Positive values indicate that the Berkut allele had a positive effect on recombination. Blue hues represent positive effects, i.e. Berkut allele favors increased recombination, the red hues represent negative effects, i.e. Berkut allele suppresses recombination. Intensity of effect ranges with the darker shades of the boxes
(e) Venn diagram depicting overlap of bi‐parental mapping versus joint mapping for TCO, pCO, and dCO.
(f) Venn diagram showing overlap of the joint mapped QTL regions detected for the TCO, pCO, and dCO.
(g) Summary of QTL mapping results in 28 NAM families for chromosome 6B. Each family is represented on the y‐axis with horizontal dashed lines, starting with NAM1 up to NAM30. Red, blue, and yellow bars represent QTL regions for TCO, pCO, and dCO, respectively, found in bi‐parental mapping populations. Green squares represent significant SR and JCIM regions