
Figure 3.
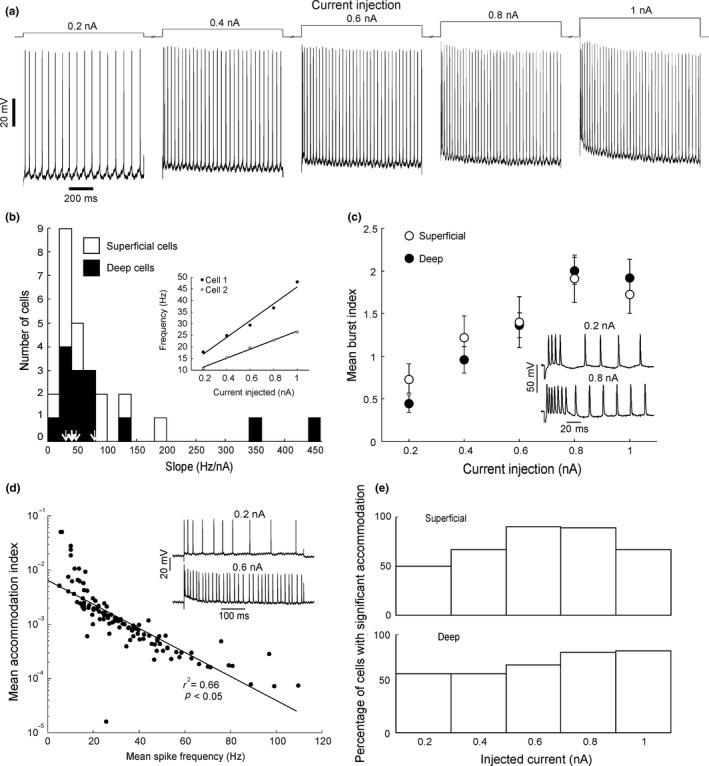
Spiking responses to current injection. (a) Example spike trains evoked by different current injections. (b) Histogram of distribution of gradients of linear regressions for frequency versus current relationships for all cells tested. Values of labelled pyramidal neurons (5 cells) are indicated by arrows. Inset shows two examples of relationship between current injected and mean (±SE) frequency of evoked spike trains. Straight lines represent linear regressions. (c) Mean and SE of burst indices (see Section 2) for all cells plotted against current injection. Inset shows example of bursting behaviour of a neuron to two different levels of current injections. (d) Mean accommodation index for each cell plotted against the mean frequency of the evoked spike train on a semi‐logarithmic scale. Inset shows example raw data for two levels of current injection. (e) Bar chart of percentage of superficial and deep cells with significant accommodation