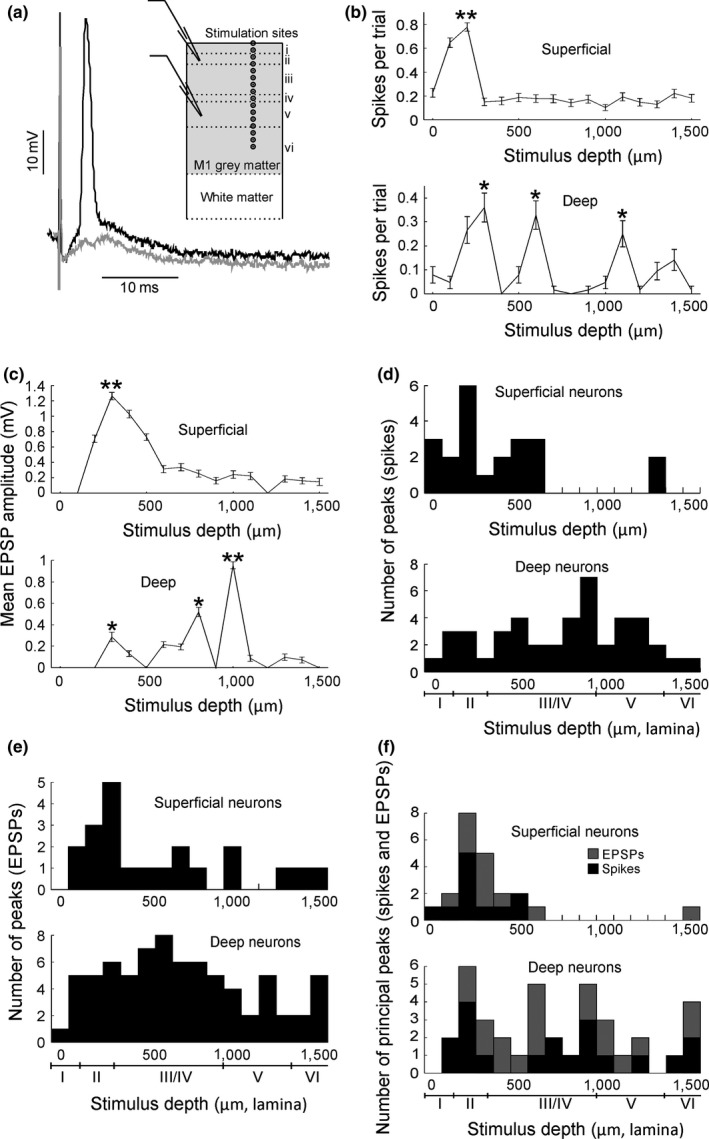
Figure 4.

Responses to extracellular stimulation. (a) Two sample traces of a spike (black) and an EPSP without spike (grey) elicited by extracellular stimulation. Inset shows scheme of recording setup. (b) Sample responses from two spiking neurons to electrical stimulation of different cortical depths. (c) Sample responses from 2 nonspiking neurons to electrical stimulation of different cortical depths. (d) Histograms of significant spiking response peaks for superficial and deep spiking cells in response to stimulation of different cortical depths. (e) Histograms of pooled significant EPSP response peaks for superficial and deep nonspiking cells. (f) Histogram of pooled principal peaks for superficial and deep cells for both spiking and nonspiking cells. Equivalent lamina depths underneath histograms are taken from Shepherd (1998). (b) Top panel: p = 5.65e‐24; bottom panel: p = 1.22e‐80; One‐way ANOVA test. (c) Top panel: p = 6.57e‐85; bottom panel; p = 1.14e‐221; One‐way ANOVA test. *Stimulus contacts that are significantly higher both neighbouring contacts. **Principal peak ‐ stimulus contacts that are significantly higher than all other contacts
