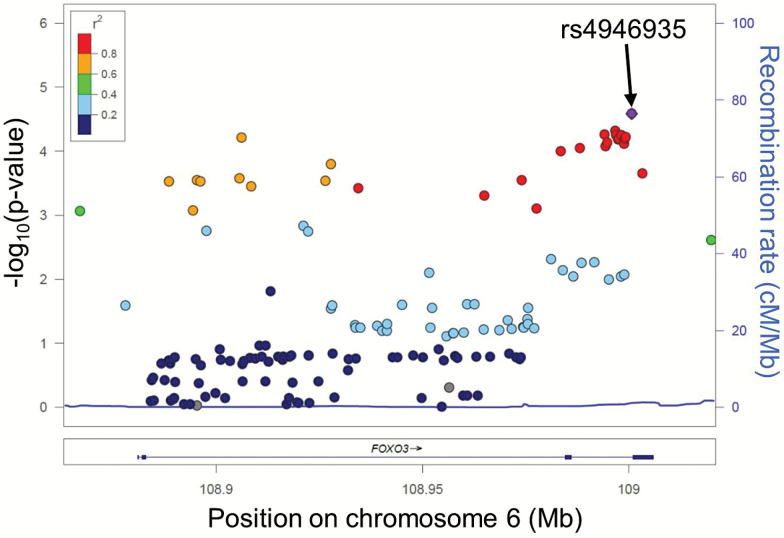
Figure 2.
Regional association plot of meta-analysis results. The x-axis represents the genomic positions within FOXO3, the y-axis on the left represents –log10 of the p-values from the meta-analysis, and the y-axis on the right represent the recombination rate. The colors show the strength of the linkage disequilibrium between the most strongly associated single-nucleotide polymorphism (SNP) (rs4946935) and the other FOXO3 SNPs studied.

