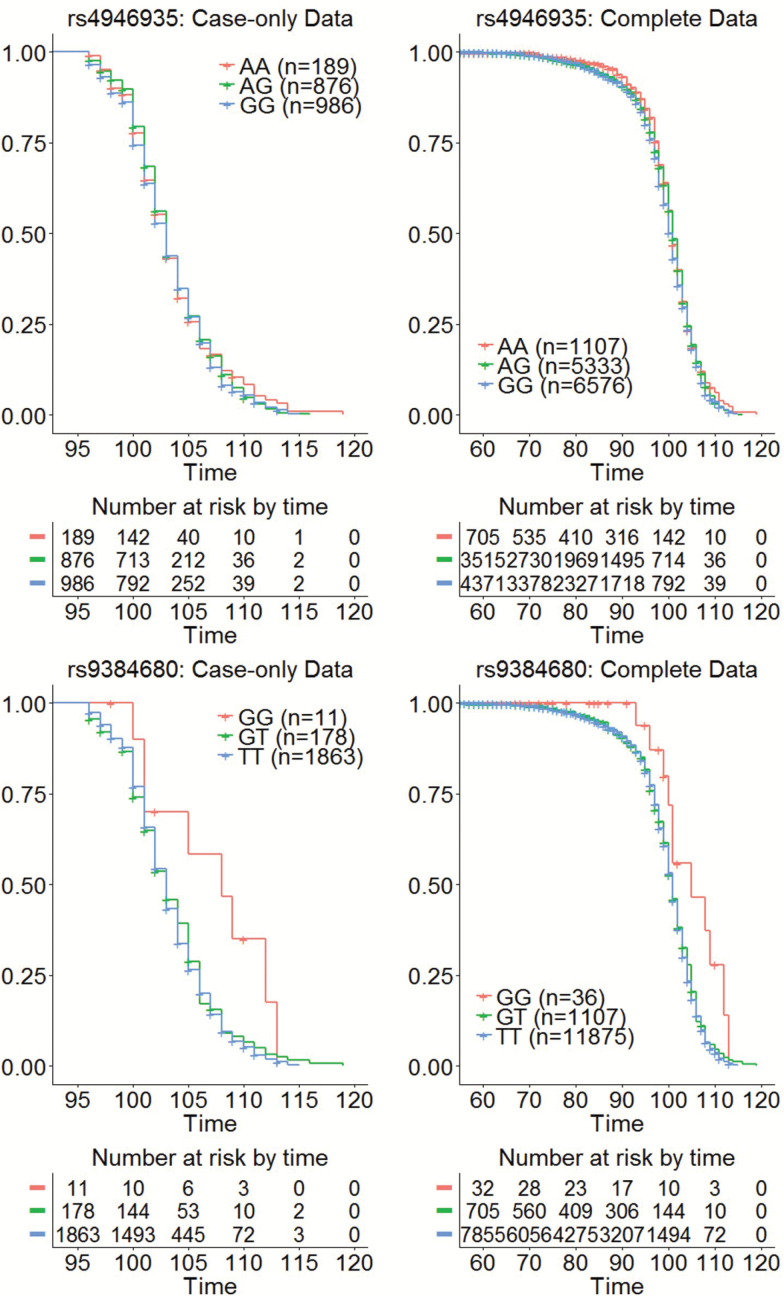
Figure 4.
Kaplan–Meier curve of survival stratified by the genotypes of rs4946935 and rs9384690. Blue: carriers of homozygote non-longevity variant. Red: carriers of the heterozygote genotype. Green: carriers of the homozygote longevity variant. Left: analysis in survivors past the age at which less than 1% of the 1900 birth year cohort survived. Right: analysis includes all study participants. Note that the risk table at the bottom of each Kaplan–Meier curve excludes alive subjects at last contact since their age at death is censored. The Kaplan–Meier curves are generated assuming noninformative censoring.

