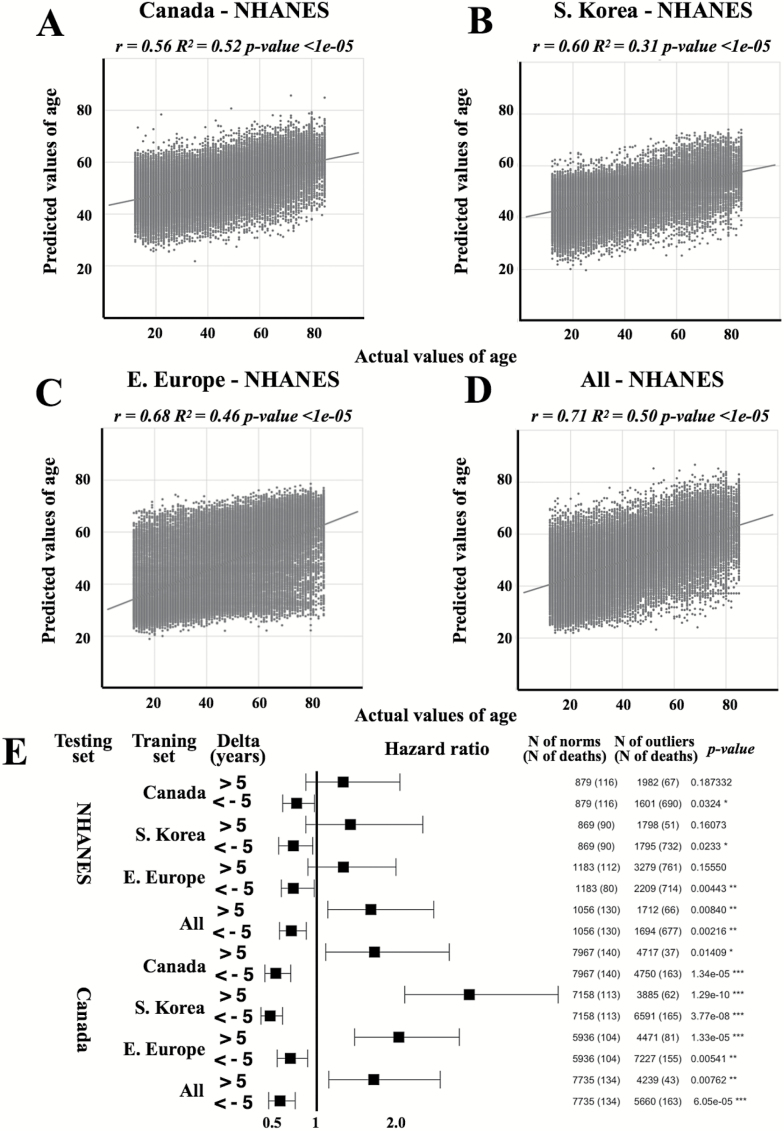
Figure 6.
Validation of models. Actual chronological age vs predicted age for NHANES dataset using networks trained on Canadian (A), Korean (B), European (C), and (D) all patient population samples. The linear regression lines are shown in dark grey. Networks trained on both E. European and all patient samples demonstrated the higher accuracy of age prediction of NHANES dataset. (E) Hazard ratios for the NHANES and Canada datasets. A Cox proportional hazards regression model was used to relate survival time to the accelerated aging group (delta >5) and slowed aging group (delta <5). Patients predicted younger their chronological age has a lower mortality risk, while patients predicted older has a higher risk. Each row represents a hazard ratio and 95% confidence interval. Note: “∗∗∗” for p-value of .001; “∗∗” for p-value of .01; “∗” for p-value of .05.

