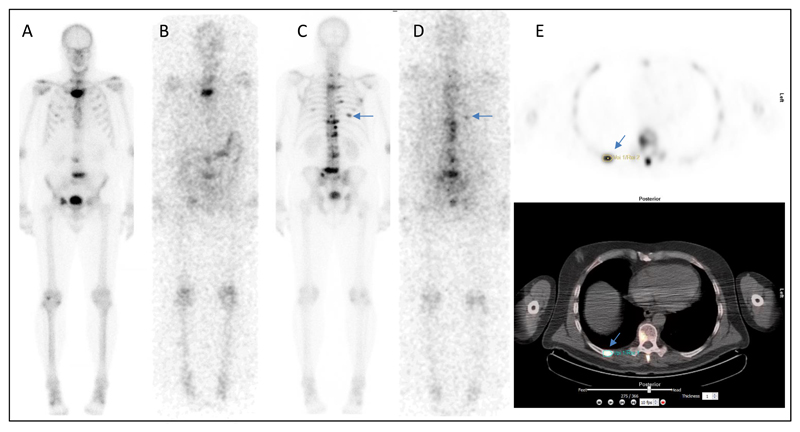
Figure 1.
Examples of acquired images for patient 2. A) and C) show 99mTc-MDP whole-body imaging. B) and D) show 223Ra WB imaging 6 days after therapy administration. Arrows indicate uptake in posterior right rib. E) 18F-Fluoride PET/CT imaging at baseline including FLAB outlining of posterior right rib lesion used for volume estimation.

