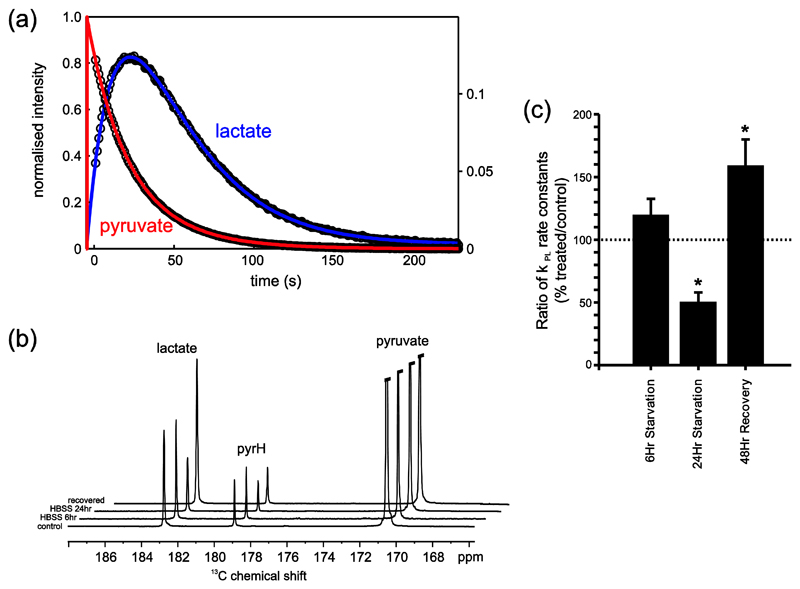
Figure 3.
Hyperpolarized 13C-data from an HCT116 Bax-ko cell assay. (a) Example fitting of the temporal data of pyruvate (red - left hand scale) and lactate (green - right hand scale) from which apparent exchange rate constants can be derived. (b) Example sum spectra showing the sum over the entire dynamic time series from a control cell experiment, following 6hr starvation with HBSS media, following 24 hr starvation with HBSS media and after 24hr starvation followed by 48hr cell recovery in full media. The spectrum displays peaks from pyruvate, lactate and pyruvate hydrate (Pyr H). (c) The mean ratios (treated/24hr vehicle-control) of the apparent forward reaction rate of pyruvate to lactate exchange kPL (derived from fitting of the experimental data and normalized to cell number) (± s.e.m.) for 6hr HBSS starvation, 24hr HBSS starvation and 24hr starvation followed by 48hr recovery in HCT116 Bax-ko cells. Minimum n=3 in each group. Statistically significant changes are indicated (*p≤0.05). Figure adapted from (Lin, et al., 2014b).

