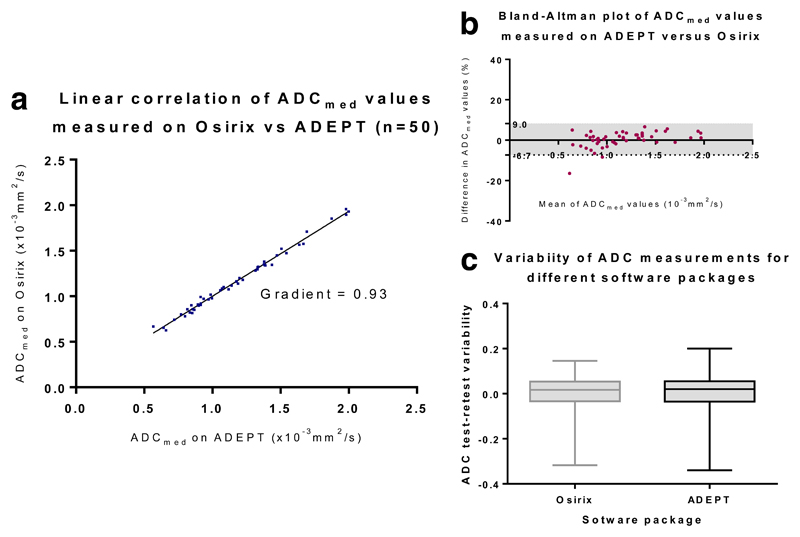
Figure 4.
(a): Scatterplot of ADCmed values (x10-3mm2s-1) obtained for whole lesion segmentation on ADEPT (IDL based) and Osirix (c-DWI) post-processing software packages
(b): Bland Altman plot of ADCmed values obtained for whole lesion segmentation on ADEPT (IDL based) and Osirix (c-DWI) post-processing software packages
(c): Boxplot confirming no significant difference in test-retest ADCmed value variability for measurements generated by analysis on ADEPT (IDL based) and Osirix (c-DWI) software

