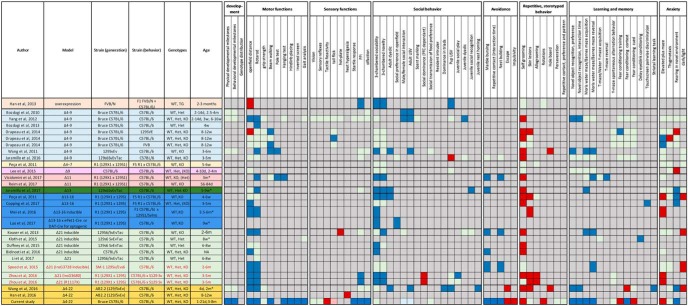
Figure 11.
Main features and comorbidities associated with Phelan–McDermid displayed by different mouse models with Shank3 deficits. Green indicates an absence of genotype difference. Blue indicates a decrease of the associated behavior in Shank3-deficient animals. Red indicates an increase of the associated behavior in Shank3-deficient animals. Gray indicates the behavior has not been studied in the corresponding article. Age column: d = days, w = weeks, m = months, * indicates that only the age at the beginning of the testing was provided.

