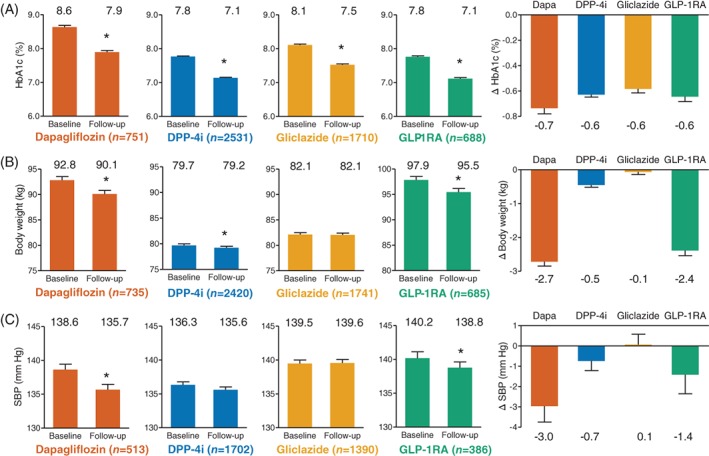
Figure 1.

Within‐group analysis of effectiveness. For A, glycated haemoglogin (HbA1c), B, body weight and C, systolic blood pressure, panels show baseline and follow‐up values, along with changes from baseline (right panels). Numbers on top of columns indicate the corresponding values. Numbers between brackets indicates the number of available measures for each outcome. *P < .05 vs baseline. DPP‐4i, dipeptidyl peptidase‐4 inhibitor; Dapa, dapagliflozin; GLP‐1RA, glucagon‐like peptide‐1 receptor agonist; SBP, systolic blood pressure
