Figure 2.

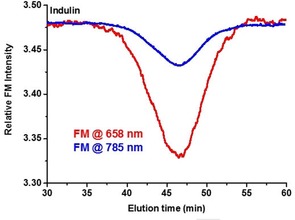
Signals of the FM recorded upon analysis of a kraft lignin sample (Indulin) with MALS detectors operating at 658 nm (red line) and in the infrared region at 785 nm (blue line).

Signals of the FM recorded upon analysis of a kraft lignin sample (Indulin) with MALS detectors operating at 658 nm (red line) and in the infrared region at 785 nm (blue line).