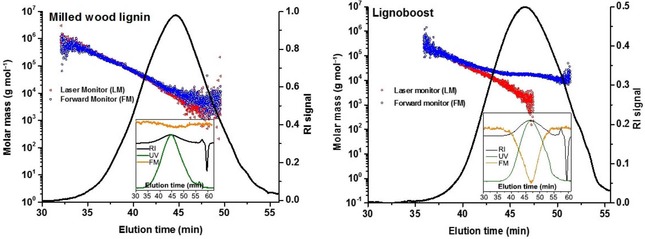
Figure 3.

Effect of using the LM and FM in MALS detection. Left: A non‐absorbing sample (pine milled‐wood lignin) . Results based on LM and FM are largely identical. Right: Lignoboost kraft lignin with absorption at 785 nm. Usage of the LM alone produces faulty results because of sample absorption, which can be compensated for by using the FM. Insets show the absorption in relation to the corresponding RI peak.
